Aha! Overview – L&E Tech Partner On-Demand Webinar Series

Following our webinar on emerging technologies within qualitative research we wanted to share our on-demand webinars and highlights of each of our technology partners. We are continuing on with Aha! and Renee Wyckoff’s (our Research Design Engineer) summary of how this interactive asynchronous online qual platform can be utilized in several different ways for just about any type of qual, and sometimes quant research.

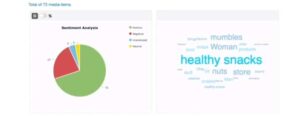
Aha! is an interactive asynchronous online qual platform that can be utilized in several different ways for just about any type of qual, and sometimes quant research.  Just one of the benefits is that it can be set up and launched DIY style with an extremely user friendly platform, or Aha! can take the reins from the start and supply study design, programming, recruiting, project management, end of study analysis, and more.

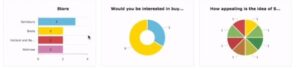
Aha! creates interesting activities and exercises based on a client’s specifications that are both fun, and insightful, with keeping respondents engaged as a top priority!  Clients can interact with respondents either one on one, or in a community setting.  Respondents can participate in whichever way is convenient for them, either via mobile device or home based device.  Another way to keep them engaged!

Just some of the ways that Aha! can be utilized –

  • Pre-focus group homework assignments
  • Multi-day qualitative studies
  • Custom created studies, both qual and quant, the possibilities are endless!

Interesting and fun activities for engaging respondents –

  • Guided storytelling, prompts respondents to share their thoughts and feelings
  • Creative collage tool, respondents can import their own images and words, or choose from pre-selected sets to describe how they feel about something
  • Perceptual mapping tool, respondents can map out how they perceive brands or experiences
  • Journey mapping, respondent can create a collage based on a specific topic
  • Fill in the blanks, a digital “mad libs” if you will!
  • Video and image uploads via multiple devices
  • Video/Mobile diaries
  • Concept testing, clients can post videos and images for respondent feedback
  • Pinboards, a social, collaborative environment where respondents can post videos, images, or words based on a specific subject or task
  • Wishing wall, respondents post wishes and what they like prompted by sentence starters

For a more in depth overview of Aha! and their capabilities, watch our on-demand tech webinar by clicking here!

Webinar | L&E Webinar Series: Emerging Methods in Qualitative Research Technology

Free on-demand L&E Webinar

On September 18, 2018, L&E hosted our fourth webinar in our webinar series for 2018 with Charlie Rader and Lenny Murphy as our panelists. The topic of this webinar was on the latest technologies in qualitative research.

Guest Speakers: 

  • Charlie Rader, Digital Insights Designer at Procter & Gamble
  • Lenny Murphy, Executive Editor & Producer at GreenBook

Technology is bringing researchers, stakeholders and brands closer than ever to their consumers. 

Small consultative researchers and corporate researchers alike need to provide the same impact from their research. Now, no matter the magnitude of your project or depth of your team, you can provide the same actionable insight with support from new qualitative research technology.

This webinar will:

Guide you through key areas that are becoming increasingly powerful in accessing high quality insight such as:

  • Neuromarketing
  • Virtual reality
  • 360° streaming
  • Video analytics
  • In-the-moment online tools

Learn about some of the top companies taking advantage of key technology in qualitative research

Focus Forward Overview – L&E Tech Partner On-Demand Webinar Series

Following our webinar on emerging technologies within qualitative research we wanted to share our on-demand webinars and highlights of each of our technology partners. We are continuing on with Focus Forward and Renee Wyckoff’s (our Research Design Engineer) summary of how they offer an online transcription portal and keyword search so you can identify themes for reporting.

L&E Transcription services, powered by Focus Forward is a comprehensive transcription service that will work with your specific needs and budget in mind. L&E Transcription has several different levels of service to suit the desired outcome.

Some of the features of L&E Transcription Services –

  • Speed and quality of service compared to price
  • Audio is transcribed via “segmentation” technology to result in quality transcripts, faster
  • Offered in all L&E locations
  • Future API to L&E Streaming service that will tie transcription and streaming services into one user friendly system

L&E 360° Camera

L&E 360° camera is the latest in focus group camera technology!

  • Still hardware at the center of the table with multiple lenses to provide an unobtrusive camera feed without distraction
  • Audio highlights the speaker, as participants share, the camera zooms in on that speaker to provide close-up imagery. Facial expressions and body language captured in HD quality
  • Camera clearly picks up participant sharing, such as pictures, homework assignments or other stimuli

For a more in depth overview of Focus Forward and their capabilities, watch our on-demand tech webinar by clicking here!

Emerging Methods in Qualitative Research Technology | New White Paper from L&E

Emerging Methods in Qualitative Research Technology

Landing a full 360 view of the consumer

White Paper Download

Technology is bringing researchers, stakeholders and brands closer than ever to their consumers.

Small consultative researchers and corporate researchers alike need to provide the same impact from their research. Now, no matter the magnitude of your project or depth of your team, you can provide the same actionable insight with support from new qualitative research technology.

This paper will guide you through the following key areas that are becoming increasingly powerful in accessing high quality insight.

  • Neuromarketing
  • Virtual reality
  • 360° streaming
  • Video analytics
  • In-the-moment online tools

But who can you trust with your data? In this paper we also identify some of the top companies taking advantage of key technology in qualitative research.

To continue reading, download our latest white paper by clicking here (no form to fill out).

LivingLens Overview – L&E Tech Partner On-Demand Webinar Series

In anticipation of our upcoming webinar on emerging technologies within qualitative research we wanted to share our on-demand webinars and highlights of each of our technology partners. We are kicking things off with LivingLens and Renee Wyckoff’s (our Research Design Engineer) summary of how this powerful video tool incorporates speech to text analytics to help qualitative researchers turn video uploaded by respondents into actionable insights!

How does LivingLens work?

  • Easy to use central dashboard for managing uploaded videos
  • Multiple ways to search your video content, such as, but not limited to:
    • Word cloud for frequency of mentions in text
    • Filter by survey responses, demographic data, etc.
    • Text search via human or machine transcriptions on the platform
  • Create clips from multiple video sources
  • Easy to use client analytics model to assist in understanding content on an aggregated level
  • Key theme word cloud across all video content

  • Clickable charts to take you directly to the relevant video content

  • Transcript export capabilities

For a more in depth overview of LivingLens and their capabilities, watch our on-demand tech webinar by clicking here!

Visualizing research to make an impact – Practical tips for getting the most out of PowerPoint

When the large amount of information behind quality research is transformed into a story, the story needs to be complemented with high quality design to ensure it is optimized for client engagement.

Visualizing data in quantitative research gets a lot of attention in the insight industry. But communicating qualitative insight requires the same level of attention to visual communication and design. It just comes in the form of (a lot of) words and verbatim, which need to be organized and structured into a well-designed visual representation in order to make an impact. From visualizing direct consumer quotes to Word Clouds, the design skills behind communicating qualitative research should be pushed.

Although PowerPoint is a common tool for creating insights reports, it is ultimately a design software, and this means that whoever uses it effectively becomes a designer. So, here are some design principles that you need to know in order to keep your insight presentation or report clear, professional and engaging.

Hierarchy 

Designers use different design elements to curate the viewer’s experience carefully. Hierarchy is the order in which the viewer sees each aspect of the design, so the eye’s path can be controlled by factors such as size, color and positioning. This allows the viewer to see the most important information, for example the title, or the key insight from your study, before anything else. The event flyer below shows how the design works to draw the viewer’s eye from one event detail to the next.

Alignment 

Imagine driving into a parking lot and finding that all the white lines indicating parking spaces had been removed. How would you know how to navigate the mess of parked cars to find your own space? The white lines turn the parking lot into a grid system, which creates a simple and effective experience for us. Our clients desire this same simple experience when viewing a qualitative research report. Alignment guides the positioning of shapes, charts and text according to straight lines, in a grid system, making it visually appealing to the audience, and easier for the client to see the key insights upfront. However, these straight lines don’t necessarily have to be at right angles – just make sure you are consistent with the angles of all features of the design.

Balance

The way you position and use elements of the design, such as text, images and color, affects the balance of the page or slide overall. For a clear and aesthetically pleasing design, the design of both sides of the page need to be equal, although this can be done both symmetrically and asymmetrically. A symmetrical balance is when both sides match identically across a center line, while an asymmetrical design is when the sides contain different design aspects but ultimately each side has the same weight (as shown below). For asymmetrical designs you might want to consider an object’s size, how close it is to the design’s center line, and use of texture and color to create the illusion of balance.

Contrast

Clever use of color will help to highlight important aspects of the design that you want to stand out and make an impact, like a powerful quote from a consumer. Using contrasting shades (e.g. yellow and blue) will catch the audience’s eye, while using more complementary or similar tones (e.g. two different shades of blue) will be less noticeable. In qualitative research this could be useful for insight boxes or quotes that you want to catch your client’s eye immediately.

These simple design tips work together with several other principles – such as white space (to make your insight easier to digest) and proximity (to help your audience understand relationships) – to help qualitative researchers visualize their research.

While qualitative research may not require the design of statistical charts like in quantitative research, communicating qual still requires a high standard of design outputs to keep clients engaged. Making sure your presentations and reports are consistent and aesthetically pleasing, and simple and easy to navigate, will help your insights communication hold maximum engagement and really make an impact.

If you want to know more about the techniques behind successfully delivering your insight to clients, from the art of storytelling to the technology to power it, check out our white paper on insight communications here.

The art of storytelling – The role of knowing your audience

A major part of creating actionable insights for clients is making sure we, as qualitative researchers, communicate research findings to them effectively – and a good way of doing this is through the art of storytelling. There are a number of elements that need to be considered to make sure your story makes an impact, including structure, timing and language, as well as the medium used to tell it. But all of these factors are subjective to your audience. As a market researcher, you know that understanding your audience is a key ingredient in marketing, but it’s also integral to the storytelling process in research; a non-tailored message will likely be ignored.

So, storytelling is an essential skill for the researchers of today. And clearly, before crafting your story you need to define your audience. Find out how much the people you are creating a report or presentation for know about your topic, and where there might be barriers present in their engagement. Ask yourself what team they’re on (are they a marketer or a market researcher or in IT?), what sector your client is in (automotive vs. finance), and how much experience they have (are they C-Suite or non-management?). Once you have a firm idea of who you’re communicating with and what they want to hear, you can think about how to tailor the story to resonate with them.

Good storytelling involves structure. The reality is that if your audience is in the C-Suite they’re going to be busy and will not be able to engage with every element of your story. In this case, you must make sure the essential takeaways are upfront, so carefully plan your structure to exclude any unnecessary details. CEOs should never feel overwhelmed by data and information, and instead should be presented immediately with the main findings – the insight that will inspire them to take action.

Your audience will also shape the language of your story. If your audience has little knowledge of qualitative research, they’re unlikely to understand any technical terms – so lose the jargon. Some of the technical specifics of research may also be lost when talking to client-side researchers and marketers, so instead, use clear and simple language to define your points. Use of language is especially important if you’re speaking to the C-Suite. Make sure to use their language, as they won’t have time to spare interpreting what you’ve said or asking questions later on.

Language also comes into play when you set the scene for your story. When speaking to clients from specific industries, like automotive or finance, try to tap into the language they speak. This effort to relate to your audience and provide a snapshot of their industry will suggest your expertise in the field and will help gain your client’s trust.

The medium used to convey your story is also dependent on your audience. Has the client asked for a presentation, a full report, or just a top-line summary? The key is to optimize the options at your disposal. If you’re doing a presentation, keep it short, and then provide a follow up document with more detail. If you’re doing a report, make sure to include a summary or an infographic.

But no matter who your audience is, you need to make sure they’re full engaged with the insight and what it means for them. This can be done by combining the insight or data with visuals such as infographics, photos and videos to provide grounding examples of reality that the audience can relate to. Visuals are important when communicating insight because large quantities of written information can be overwhelming and become meaningless. Small data is especially useful when communicating qualitative research; video in particular really brings the respondents to life and allows clients to understand their customers first hand. It brings clients right into the focus room, helping them to feel invested in the actual research, and really hear what their customers are saying.

So, when telling a good story, you need to ensure your message is suitably targeted so it won’t be given the cold shoulder. Knowing who you’re speaking to will allow you to design a story that uses an approachable language style, structure and form, and that is contextualized around what the audience already knows about your topic. Ultimately, we tell stories to encourage a response from the audience, and this is no different in research, where the goal is to deliver actionable insight right to the decision makers.

If you’re interested in learning more about building impactful communications through storytelling and finding the golden thread in the information, check out our white paper on insight communications or watch our recent webinar on this topic.

Renee’s Takeaways – Q2 Quarterly Roundup

1. Regarding sharing qualitative insights – When we share our insights with clients, we want to keep it fresh, and keep them engaged throughout our journey. We heard directly from our expert panel during our June webinar “Qualitative Analysis and Insight Communication” about their experiences, and things they’ve learned. Here are just a few –

  • Be sure to incorporate the use of multimedia to keep your presentation interesting.
  • If you can, put yourself in the consumer’s shoes. Immerse yourself in their experience, go through their exercise, walk through it the way they would. By doing this, not only do you have the data to share, but you have a unique perspective to share your insights.
  • Do not just plow through your insights! Take some time to consider the room dynamics, and be prepared to pivot on the fly based on that.
  • Use tools such as social media listening tools, and the like. These tools can help pour through thousands of reviews and analyze them quickly to get to some rich insights.
  • Try to dig deep into what the client already knows. That way, you are only delivering fresh insights, and not repeating what they’ve already heard.
  • Try seeing your clients as partners, and seeing them as part of the team. This creates a comfort level with asking questions that may seem uncomfortable.
  • Supply your client with leave-behinds, brochures, videos, things that get people engaged and can travel through the company on their own, after the presentation.

2. Regarding engaging with qualitative research study participants – We all know that participants like to be incentivized for sharing their opinions, and that is not going away any time soon! BUT, what we’re finding, is that there are many other reasons why people participate. They actually like sharing their opinions, most people do! They want to feel that what they’ve shared matters, and is contributing to bigger decisions being made about a product or service. So many others, stay tuned!

3. Regarding the IIEX Conference – I had the opportunity to attend the Insight Innovation Exchange in Atlanta in June. I saw some amazing presentations, as well as some new up and coming technologies for MR. Really exciting stuff!

4. Regarding recruiting and project specifications – Something that I’ve learned, many times over and over again, is to always have a plan B! We all want the perfect recruit, but sometimes it just doesn’t work out that way. It’s always a good idea to have your plan B from the very start. Take a good look at your specs and your screener, and try to anticipate where you might run into snags, and have your back-up plan in place to keep your recruit moving along smoothly.

5. Regarding feeding your brain! – Here at L&E, we have an internal learning system which is meant for both professional and personal enrichment alike. In the MR world, we need to be sharp in order to be the best partners to our clients. Here are a few things I learned from one of our recent modules –
• Maintaining an active social life can impact your brain’s health
• Taking the time to visit a new place, or read a new book will keep your brain engaged
• The food you eat affects your brain! Check out this quick video from a TED talk by Mia Nacamulli
• Exercise improves blood flow and oxygen to your brain
• And last but not least, something we all know, and can’t seem to get enough of, SLEEP!!

Until next time!

Your Research Design Engineer at L&E,

Renee Wyckoff

Renee’s Takeaways – Get the scoop on L&E’s Qual Analysis and Insight Communication Webinar!

6 Steps to Perfect Qual Webinar Series Summary

Step 4 and 5 – Qualitative Analysis and Insight Communication Webinar – Webinar held on June 6, 2018

It’s going to be hard to top this one!  In this recent webinar in our series, focusing on Qualitative Analysis and Insight Communication, we had the opportunity to chat with three extremely knowledgeable panelists on these topics. First up, Shaun Stripling who most recently left Mullen Lowe as Chief Strategy Officer, and was the Global Director of an insight consultancy called Frank About Women where she oversaw six countries of female-focused marketing efforts. Next, we had Walt Barron, Chief Strategy Officer at McKinney. Walt was a journalist in a previous life until he switched over to advertising about 19 years ago. He went to the VCU Brandcenter and has worked in agencies ever since.  Last, but certainly not least, Joan Lewis. Joan started out with Procter & Gamble, doing everything from upstream innovation to brand work and advertising in media, along with partnerships with retailers. Most recently, she’s been doing Boards of Directors work for a variety of for-profit companies, including three companies in the research, insights and analytics industry.  All of this experience in the industry totaling about 30 years!!

In this webinar, we focused on Q&A based around Qualitative Analysis and Insight Communication, tips to help make analysis easier for the researcher, and how to communicate insights to your clients in the most compelling and impactful way.

Here’s what our panelists had to say!

We started by asking our panelists to share about findings they’ve seen presented to them, as well as presenting findings to their clients.  What sticks, and what kind of approaches are most compelling.

  • Incorporate the use of multimedia to keep your presentation interesting
  • If you can, put yourself in the consumer’s shoes. Immerse yourself in their experience, go through their exercise, walk through it the way they would.  By doing this, not only do you have the data to share, but you have a unique perspective to share your insights.
  • Try to tug on the heartstrings if you can, make an emotional connection with the consumer. That, coupled with powerful data, and you’ve got a real one-two punch!

We heard some great things from our panelists as far as what works, so we thought it would also be helpful to find out a few things not to do, and what they’ve found doesn’t work!

  • Do not just plow through your insights! Take some time to consider the room dynamics, and be prepared to pivot on the fly based on that.
  • DO NOT ever give your client a large, printed out report, they will never read it! Try putting the insights that you’ve shared at the end of the report, at the beginning. You’ll find that most people will then come on the journey with you, because now, they are intrigued.
  • Don’t show 10 slides about your company background before getting to the insights. Save them for the end, and keep it minimal.

We covered some big picture items, then moved on to focus in on some of the smaller moving parts.  Next, we asked about useful tools that help bring data to life.

  • Assign pre-work. It can be a great way to jump past some of the necessary items you have to cover when you’re looking for consumer information and insights.
  • Use tools such as social media listening tools, and the like. These tools can help pour through thousands of reviews and analyze them quickly to get to some rich insights.
  • The use of video clips can enrich your story, hearing it directly from the consumer.

Next, we asked about best practices for delivering insights to clients.

  • Try to dig deep into what the client already knows. That way, you are only delivering fresh insights, and not repeating what they’ve already heard.
  • Maybe a little bit of a cheat, but write your hypothesis first. Then, either way, right or wrong, you’ll look for the data to prove it, and perhaps uncover some insights you didn’t expect.
  • Have a conversation about what disproved your hypothesis, if that is the case. What did you hear that forced you to rethink?

We shifted direction a little bit, and went on to discuss a very common problem in delivering insights, confirmation bias.  How do we reduce that effect with our clients?

  • Ask your client right up front for permission to probe “the sacred cows.” Are they okay with you digging a little deeper and asking them to help with the “whys.”
  • Try seeing your clients as partners, and seeing them as part of the team. This creates a comfort level with asking questions that may seem uncomfortable.
  • Find your partner, or ally in the company or whoever is helping bring the work into the company. Very often, they are the ones who want the company to be more insight driven.

And last, we asked what happens to a qualitative report once it’s released “into the wild?” What kinds of report content and format follow it through the organization?

  • Try to consider your presentation back to the client the beginning of the journey, instead of the end.
  • Create a plan at the start to carry the report through the organization, beyond a presentation.
  • Supply your client with leave-behinds, brochures, videos, things that get people engaged and can travel on their own.

We hope you found this summary to be helpful! If you didn’t register for this webinar you can listen to this webinar in its entirety, or download a free, transcribed version by clicking here.

Be on the lookout for our next webinar, which will be this fall. If you can’t wait until then, you can always view our on-demand webinars and learn about the latest technology solutions. Don’t forget to subscribe to our blog so you can keep up with what is happening at L&E!

Until next time!

Your Research Design Engineer at L&E,

Renee Wyckoff

6 Steps to Perfect Qual Series: Step 5 – Insight Communication | New White Paper from L&E

6 Steps to Perfect Qual

White Paper Download

Step 5: Insight Communication

Once you’ve completed your qualitative research, it’s crucial to communicate the results in a way that motivates clients and stakeholders to take action. So, how can this be accomplished?

This penultimate white paper of our series explains the importance of telling stories with your research, using a golden thread and impactful deliverables to make sure your message is engaging and easy to follow. Most importantly, the white paper includes practical tips to get the most out of tools such as PowerPoint, video and word clouds.

Learn how to:

  • Build impactful communications through storytelling (with practical advice on finding the golden thread in the information)
  • Different ways of communicating insight using technology
  • How to get the most out of deliverables such as PowerPoint

To continue reading, download our latest white paper by clicking here (no form to fill out).